Analyzing OS logs, application logs and Citrix VAD logs is a crucial part of your troubleshooting efforts. In the case of Citrix VAD, unless you have an automated tool for log collection and analysis, you will need to manually collect and analyze the Citrix VAD logs from the various components comprising a VAD solution. Before collecting the relevant logs, you should enable verbose tracing/logging where applicable and then try to replicate your issue so that the logs or traces capture the events which lead to your warning or error. Each VAD component has its own method of activating verbose logging and its own log paths.
The following table provides the method to enable verbose tracing/logging per VAD component.
| VAD component | How to enable verbose logging |
| Citrix Storefront | In elevated Powershell window run the following command: Add-PSSnapin Citrix.DeliveryServices.Framework.Commands Set-DSTraceLevel –All –TraceLevel Verbose Set-DSTracefileLocation -ConfigFile "File Path for the Web.config of the Store you're logging for" -Location "File path of where you'd like the Verbose logging to be saved" Set-DSTraceLevel –All –TraceLevel Off (for disabling verbose logging) Make use of the DebugView Tool by Microsoft. Replicate the issue and click File à Save As in DebugView to capture the verbose log in .log file format. For Citrix Storefront generated XML logs, you can make use of the following script to format the logs in a more readable format: Also, you should consider enabling verbose tracing for the Storefront launch.ica file by following instructions in the following article: https://docs.citrix.com/en-us/storefront/1912-ltsr/troubleshoot.html Finally, consider running a Fiddler trace of the Storefront for Web site, in order to troubleshoot issues between StoreFront services and Receiver for Web. Fiddler trace needs to be enabled in StoreFront (Advanced settings) and loopback must also be disabled. Fiddler is a Web debugging proxy and can be downloaded from: https://www.telerik.com/fiddler. |
| Delivery Controllers | The Citrix Scout tool log collection process should be combined with analysis of Windows System and Application Event logs |
| Citrix VDA servers | The Citrix Scout tool log collection process should be combined with analysis of Windows System and Application Event logs. |
| Director | The Citrix Scout tool log collection process should be combined with analysis of Windows System and Application Event logs. Alternatively follow instructions in the following article: https://support.citrix.com/article/CTX130320 |
| Citrix Licensing | Refer to the following CTX article for guidance: https://support.citrix.com/article/CTX127314 |
| Citrix Cloud Connector | Review the Windows Application log |
| SQL Server instances | The SQL server error log should be combined with analysis of Windows System and Application Event logs |
| File servers | Analysis of the Windows System and Application Event logs |
| Active Directory Domain Controllers and DNS servers | Analysis of the Windows System, Application and Security Event logs |
| Citrix Workspace App | Make use of the Citrix Receiver Diagnostics Tool – For Windows, which creates a CDF trace that can be parsed by CDFControl. Alternatively follow instructions in the following Citrix articles: Citrix Workspace App for Windows Citrix Workspace App for iOS |
| Citrix Gateway | Generate a technical support bundle in the Citrix Gateway appliance by navigating in GUI console to Configuration tab and then clicking on System à Diagnostics à Technical Support Tools à Generate Support File. The technical support bundle contains the following configuration and log files: Configuration files. All files in the /flash/nsconfig directory. Newnslog files. The currently running newnslog and some previous files. Log files. Files in /var/log/messages, /var/log/ns.log, and other files under /var/log and /var/nslog. To generate a network trace: Navigate to System à Diagnostics page in the configuration tab. Click the Start new trace link in the Diagnostic page. Update the packet size to 0 in the Packet size field. Click Start to start recording the network packet trace. Click Stop and Download to stop recording the network packet trace after the test is complete. Select the required file and click Select and click Download. Open the captured trace with a packet sniffing tool like Wireshark for further analysis. Alternatively, you can run the following CLI commands for receiving a network trace: nstcpdump.sh nstrace.sh For Citrix Gateway authentication issues real time debugging run the following commands in the Citrix Gateway CLI before replicating your issue: Shell Cat /tmp/aaad.debug |
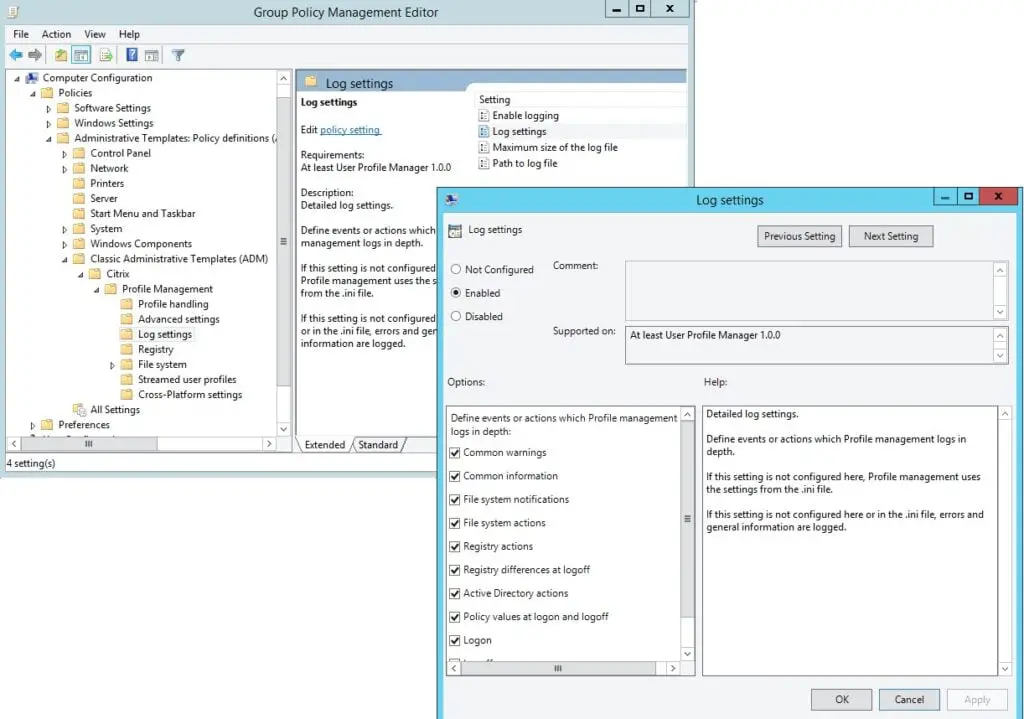
| Citrix Profile Management | Verbose logging for Citrix Profile Management (CPM) can be enabled via Group Policy. The following policies must be configured: Enable Logging Log Settings Maximum size of the log file Path to log file Instructions on how to enable verbose logging for troubleshooting CPM can be found in the following article: https://docs.citrix.com/en-us/profile-management/current-release/troubleshoot/enable-logging.html. Follow instructions in the following article which contains steps on how to use Microsoft Excel to review Profile Management log files: https://support.citrix.com/article/CTX200674 Alternatively the Citrix UPM Log Parser tool can be used: https://support.citrix.com/article/CTX123005 |
| FsLogix profiles | Setting verbose logging and other log settings in FsLogix profile container and Office365 container involves configuring the following policies which correspond to registry settings created in registry key HKLM\SOFTWARE\FSLogix\Logging: LogDir LogFileKeepingPeriod LoggingEnabled LoggingLevel (This value is set between 0 and 3 inclusive, with the following meanings. Changing this value will take effect at the next reboot. 0 - Log DEBUG level messages and higher 1 - Log INFO level messages and higher 2 - Log WARN level messages and higher 3 - Log ERROR level messages and higher) RobocopyLogPath |
| Windows Failover Clusters | Analysis of the WFC cluster logs |
The following table provides the log locations and event ID descriptions per Citrix VAD component.
| VAD component | Log file location(s) |
| Citrix Storefront | Verbose logs are generated in following path: C:\Program Files\Citrix\Receiver Storefront\Admin\Trace C:\Program Files\Citrix\Receiver StoreFront\logs Ica.log custom path (see previous table) Also consult the “Application and Services Logs à Citrix Delivery Services” and Application Event Logs at the Windows level. |
| Delivery Controllers | The Citrix Scout tool log collection process should be combined with analysis of Windows System and Application Event logs. The following article provides a thorough description of all Citrix Broker Service event logs: ; The following article provides a thorough description of all Citrix FMA Service SDK event logs: The following article provides a thorough description of all Citrix Configuration Service event logs: ; The following article provides a thorough description of all Citrix Delegated Administration Service event logs: The following Citrix Delivery Controller additional application log paths are applicable: C:\Users\<Install User>\AppData\Local\Temp\Citrix\XenDesktop Installer\ %SystemRoot%\INF Custom path to log file configured inside CDFControl |
| Citrix VDA servers | The Citrix Scout tool log collection process should be combined with analysis of Windows System and Application Event logs. Also check the following Windows event sources: Citrix Desktop Service Citrix HDX Audio Citrix HDX MediaStream Citrix ICA Service You can also separately review log files available under: /var/log/xdl/vda.log (for Linux VDA) %ProgramFiles%\Citrix\Virtual Desktop Agent\ (requires that WorsktationAgent.exe.config has the LogtoCDF property set to 1 |
| Director | The Citrix Scout (CDFControl) tool log collection process should be combined with analysis of Windows System, Application Event logs and IIS logs. For IIS log analysis, you will need to set the path and filename of the IIS log file within Log.FileName application setting in IIS management. |
| Citrix Licensing | Refer to the following CTX article for guidance: https://support.citrix.com/article/CTX127314 |
| Citrix Cloud Connector | Review the Windows Application log |
| SQL Server instances | The SQL server error log should be combined with analysis of Windows System and Application Event logs |
| File servers | Analysis of the Windows System and Application Event logs |
| Active Directory Domain Controllers and DNS servers | Analysis of the Windows System, Application and Security Event logs. Also see the output of dcdiag and repadmin commands on the domain controllers. |
| Citrix Workspace App | Review logs generated in the following locations: %localappdata%\Citrix\Receiver %localappdata%\Citrix\AuthManager %localappdata%\Citrix\SelfService C:\Program Files(x86)\Citrix\Online Plugin\Logs %localappdata%\Citrix\Browser |
| Citrix Gateway | The technical support bundle is saved on the Citrix ADC appliance in an archive at the following location: /var/tmp/support/support.tgz Review the following Citrix Gateway logs: newnslog is the current log located at /var/nslog (Must be read via the nsconmsgs command) newnslog.xx.gz are older logs located at /var/nslog nstrace.x is collected via nstrace.sh and is located at /var/nstrace vmcore.x.gz is a crash dump and is located at /var/crash kernel.x is a kernel crash dump and is located at /var/crash savecore.log is located at /tmp ns.log is a syslog file and is located at /var/log messages logs are located at /var/log auth.log are the authentication and authorization logs and are located at /var/log dmesg.* are logs which include hardware and boot sequence errors and are located at /var/nslog Detailed log collection process and log paths for Citrix Gateway can be found in the following Citrix support article: https://support.citrix.com/article/CTX227560. |
| Citrix Profile Management | The CPM logs are generated into the path configured in the “Path to log file” group policy. More details about the CPM logs are provided in the following Citrix article: . |
| FsLogix profiles | The FsLogix logs are stored in the path configured in the LogDir policy/registry setting. |
| Windows Failover Clusters | Analysis of the WFC cluster logs from the WFC MMC management console |
Utilizing the Citrix Scout (embedded into Virtual Apps and Desktops) and Citrix CDFControl tools to perform log collection can save you a lot of time since a log file bundle is generated for all servers and components in the Citrix VAD infrastructure. After Citrix VAD logs are collected from all components, they should be uploaded to Citrix Insight Services (https://cis.citrix.com) for further analysis.
For any network trace files collected from Citrix Gateway, make use of a packet sniffing tool for further analysis. Wireshark is ideal and is compatible with the network trace file format natively generated by Citrix Gateway.
You can find more detailed guidance and step-by-step procedures for analyzing and troubleshooting Citrix Virtual Apps and Desktops organized by category in my Citrix Virtual Apps and Desktops Troubleshooting e-book.


