Introduction to Azure monitoring and alerting baselines #
Azure Monitor offers the following monitoring and alerting options in all Azure services:
- Alerts. Alerts use the notion of action groups, which offer various options for alerting communications, such as email and sms. You can alert on metrics and logs, as described in the monitoring data sources article. Signals include but aren't limited to:
- Metric values
- Log search queries
- Activity log events
- Health of the underlying Azure platform
- Tests for website availability
- Metrics
- Logs
- Diagnostic settings. Diagnostic settings define which metrics and logs are distributed to which possible targets. Examples of a diagnostic settings target is a log analytics workspace, an event hub and a storage account.
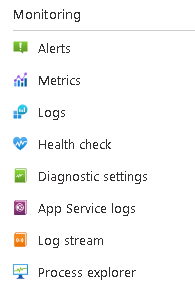
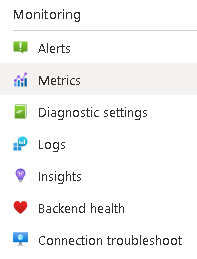
- Alerts, metrics, logs and diagnostic settings are available in all Azure services. All these options are available under the Monitoring section in Azure management portal. Each Azure service may feature its service-specific monitoring and alerting options, as shown in the below example of App Services. Each App service additionally features Health Check (for App Service), App Service logs, Log stream and Process Explorer.
- Service health troubleshooters. The available troubleshooters depend on the Azure service, since some Azure services have specialized troubleshooters available. The generally available troubleshooters in all Azure services are the following:
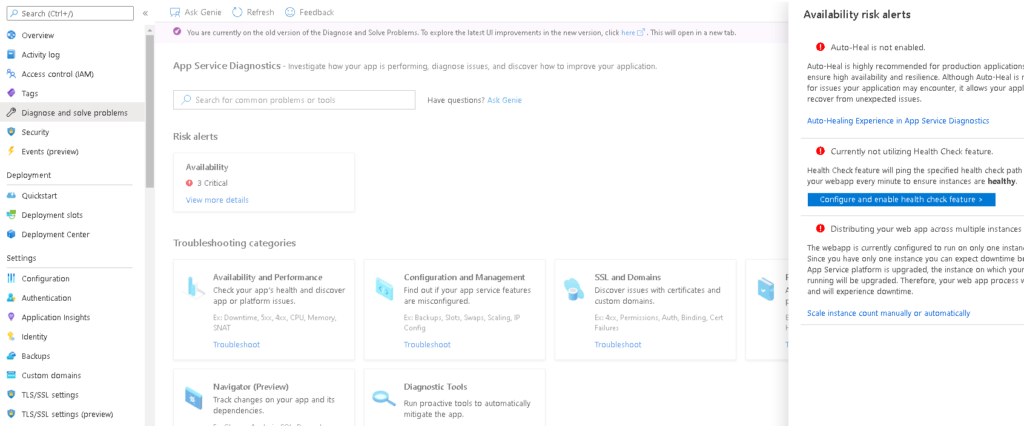
- Diagnose and solve problems. This covers various troubleshooting categories which pertain to the Azure service in question. An example for App Services is shown below.
- Diagnose and solve problems. This covers various troubleshooting categories which pertain to the Azure service in question. An example for App Services is shown below.
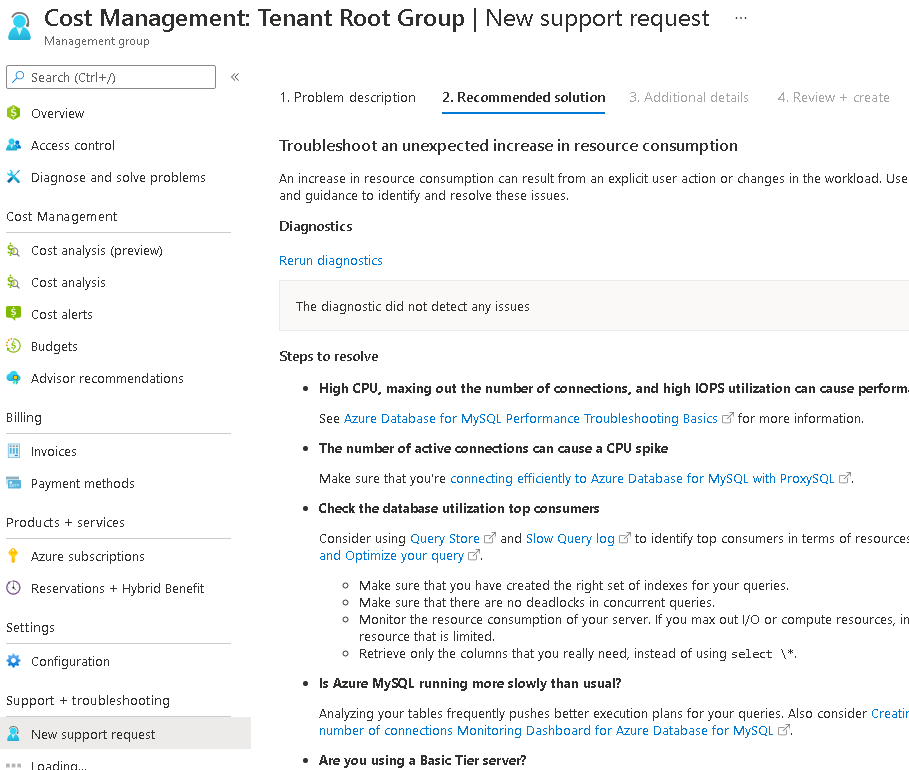
Another efficient way to troubleshoot common Azure technical issues is to use the Azure "New Support Request" wizard, which provides a list of troubleshooting recommendations, as shown in the example below.
The following sections describe how to configure monitoring and alerting at all three possible levels in Azure, tenant, subscription and resource level.
- Security incident alerts. You should follow these alerts via the Microsoft Defender for Cloud management console, which is available at: https://portal.azure.com/#blade/Microsoft_Azure_Security/SecurityMenuBlade/0.
Azure monitoring and alerting at tenant level #
General tenant health monitoring and alerting can be configured by following the below procedure:
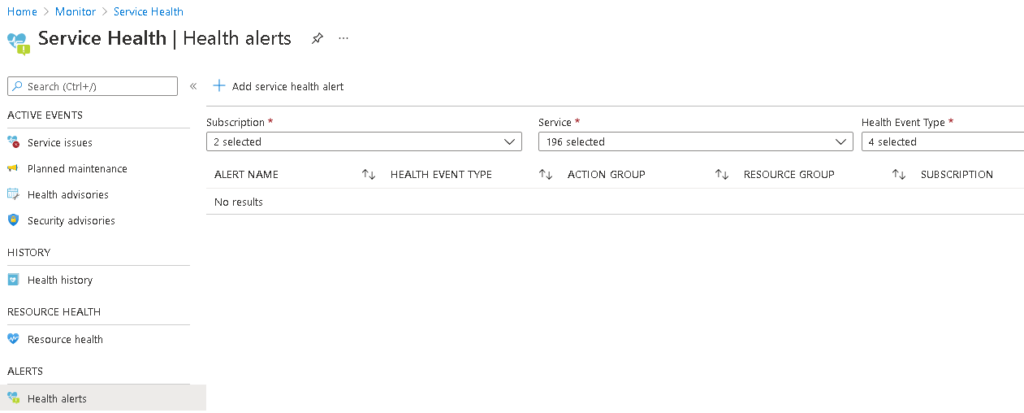
- In Azure management portal navigate to Azure Monitor and click Service Health.
- In Service Health, click on "Health Alerts".
- Setup a new alert with your desired options. This assumes that you have already created an action group or one or more recipients to receive email/sms alerts.
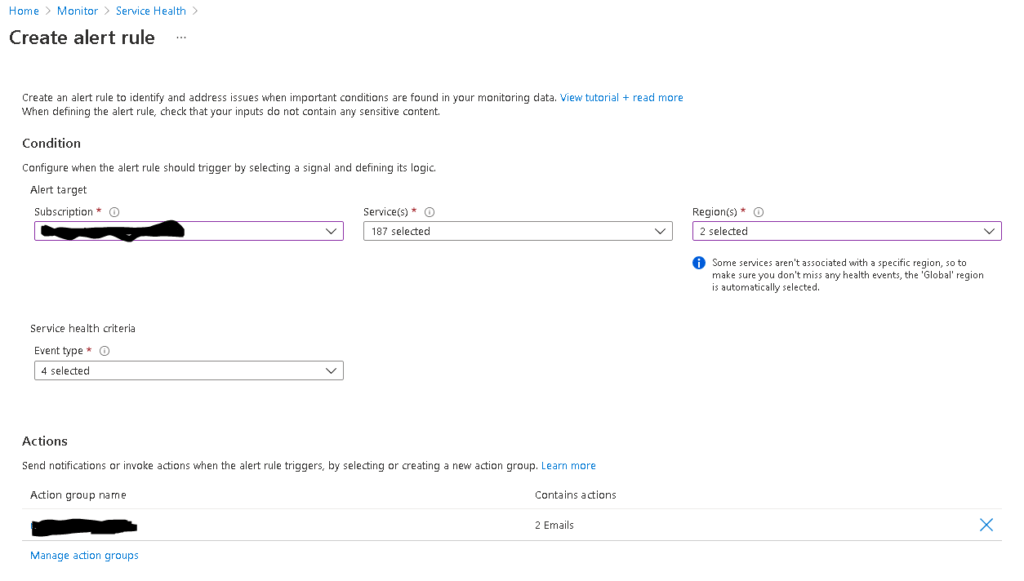
Under "Create alert rule" wizard, configure the configuration (subscriptions, services, regions to be monitored), choose the applicable event types (all recommended) and actions. Make use of a properly configured action group to have your admins receive email/sms alerts.
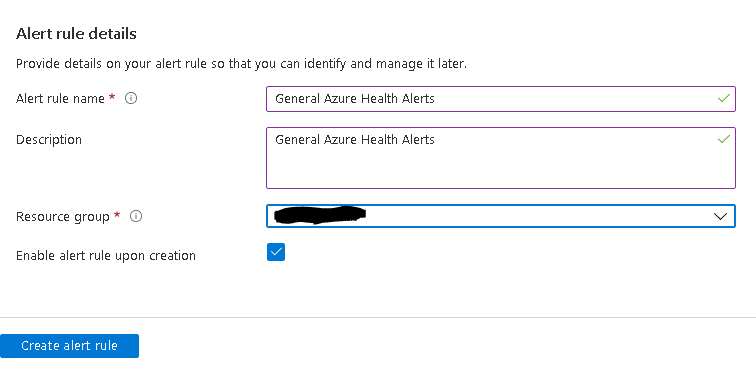
Also define your alert rule details and finally click on "Create alert rule".
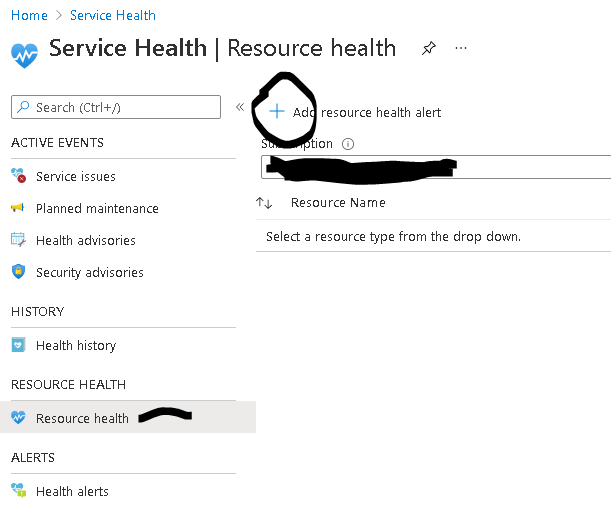
Now at the tenant level you also add at least one resource health alert. Navigate to Azure Monitor --> Service Health and click on Resource Health on the left pane. Then click on "Add resource health alert".
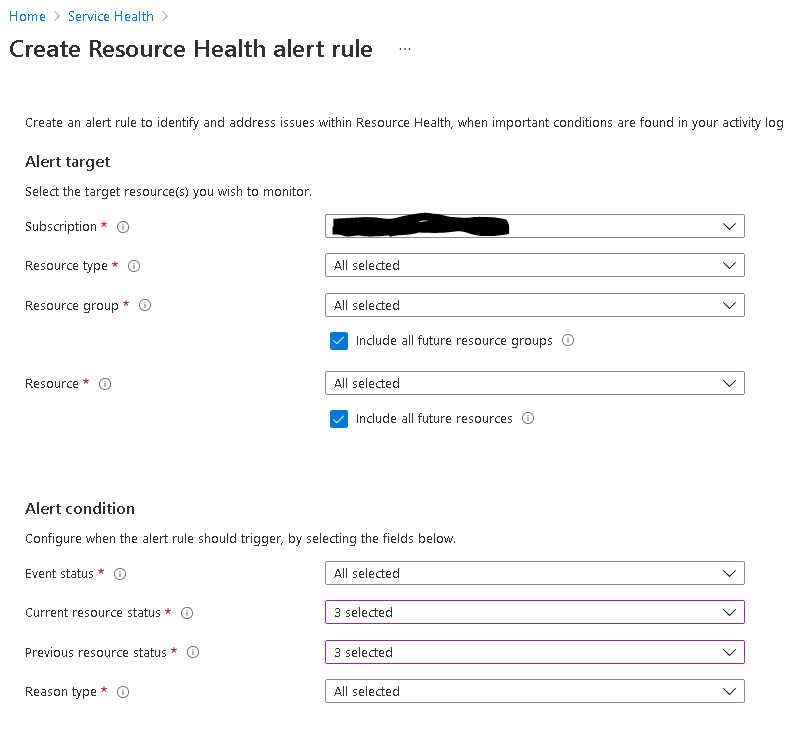
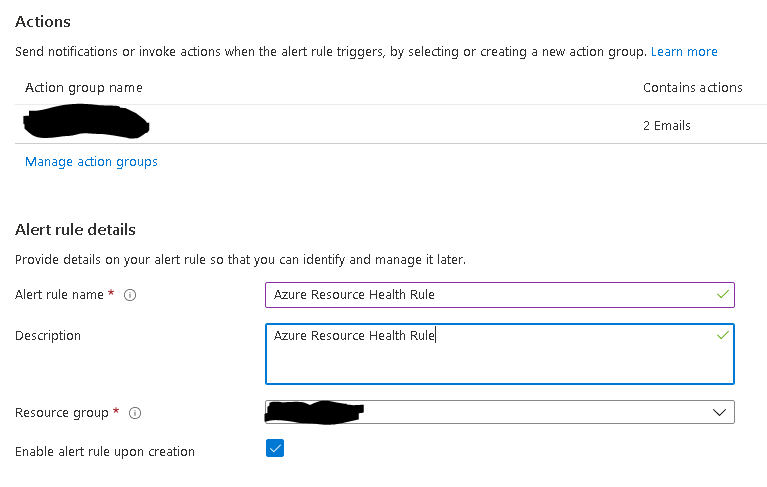
Under the "Create Resource Health Alert Rule" wizard, configure the alert target, alert condition, actions and alert rule details and click on "Create Alert Rule".
Azure monitoring and alerting at subscription level #
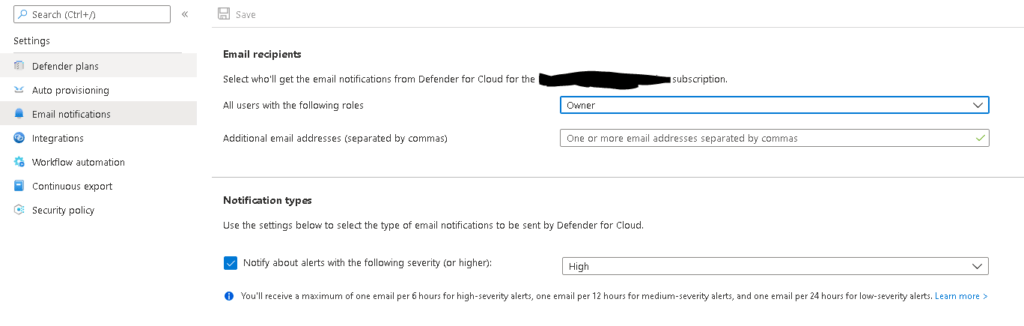
Azure Security Center and Azure Defender are now called Microsoft Defender for Cloud. It is best practice to provide admin email to receive alerts for subscription-level security issues. By default, Microsoft Defender for Cloud emails subscription owners whenever a high-severity alert is triggered for their subscription. To set up a custom security contact follow the procedure below:
- From Microsoft Defender for Cloud's Environment settings area, select the relevant subscription.
- Click on Email notifications on the left pane.
- Define the recipients for your notifications with one or both of these options:
- From the dropdown list, select from the available roles.
- Enter specific email addresses separated by commas. There's no limit to the number of email addresses that you can enter.
- To apply the security contact information to your subscription, select Save.
Azure monitoring and alerting at resource level #
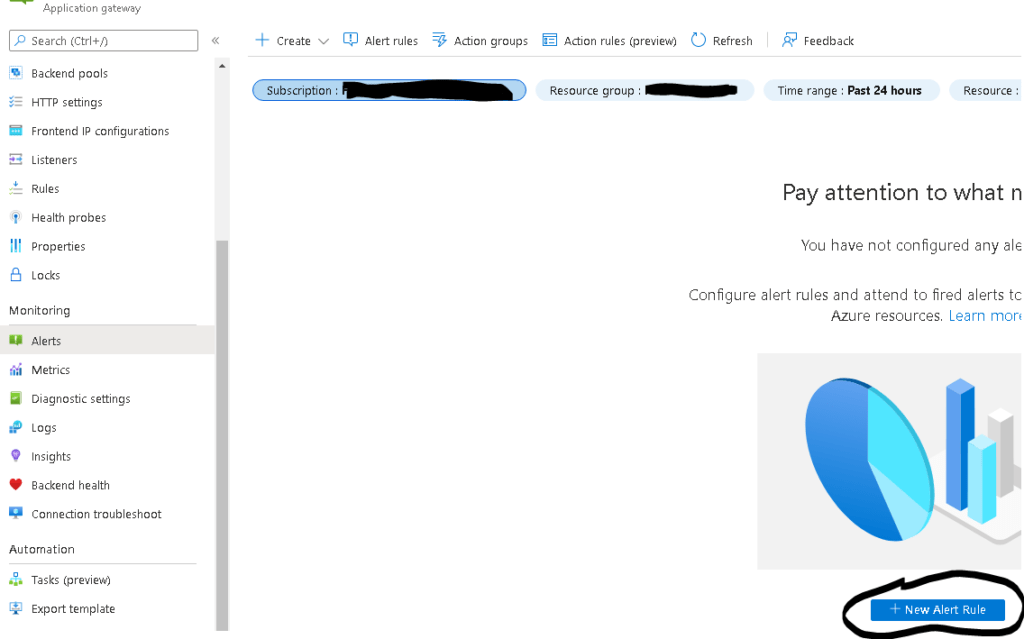
Individual Azure monitoring and alerting configurations which are service-specific are available in many Azure services, such as for example in the App Service and in Azure SQL. The below screenshot depicts the service-specific monitoring features for Azure Application Gateway.
One great example besides Application Gateway Insights and Azure App Service Application Insights, which provides more fine grained options for App Service monitoring.
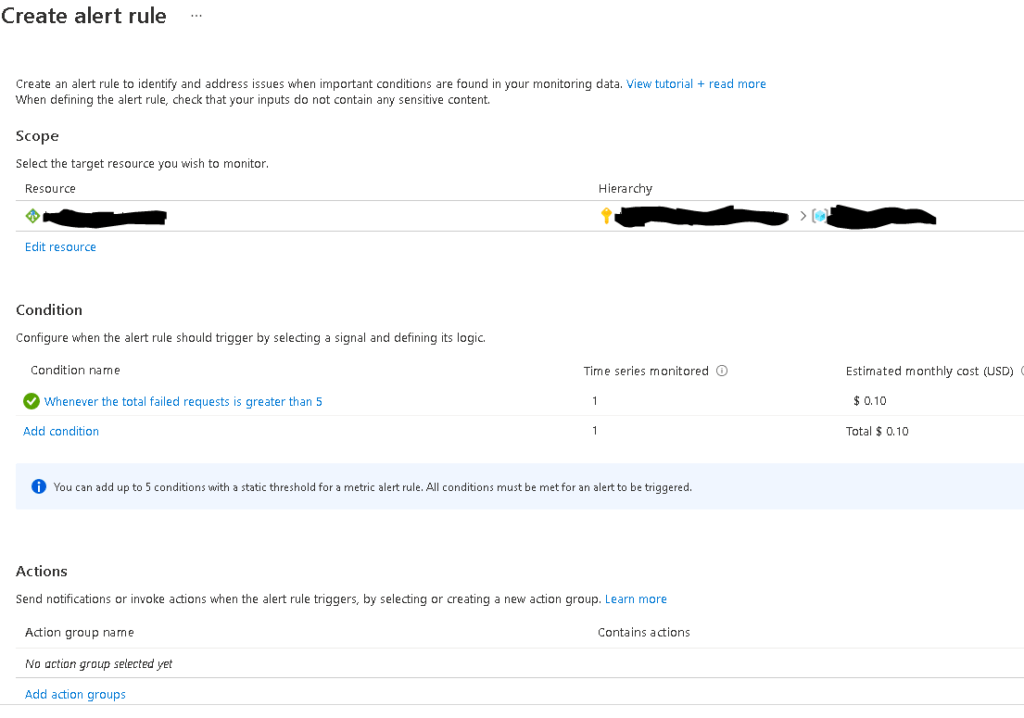
Last but not least, remember that for the critical resource of your Azure infrastructure, you should create resource-specific alerting rules, as shown in the example below for an Application Gateway resource.
You must configure the scope, conditions, actions and the alert rule details. Each alerting rule corresponds to a resource log or metric condition. One good example of an Application Gateway resource rule would be to be alerted if there is x number of failed requests through the Application Gateway.
Azure Advisor alerts #
As opposed to all previously mentioned Azure alerts which are reactive, meaning that they relate to an incident, log or metric in the Azure infrastructure, you can also configure Azure Advisor alerts which follow a proactive logic. Azure Advisor alerts allow you to proactively be alerted of any Azure Advisor recommendations about Cost, Security, Reliability, Operational Excellence and Performance.
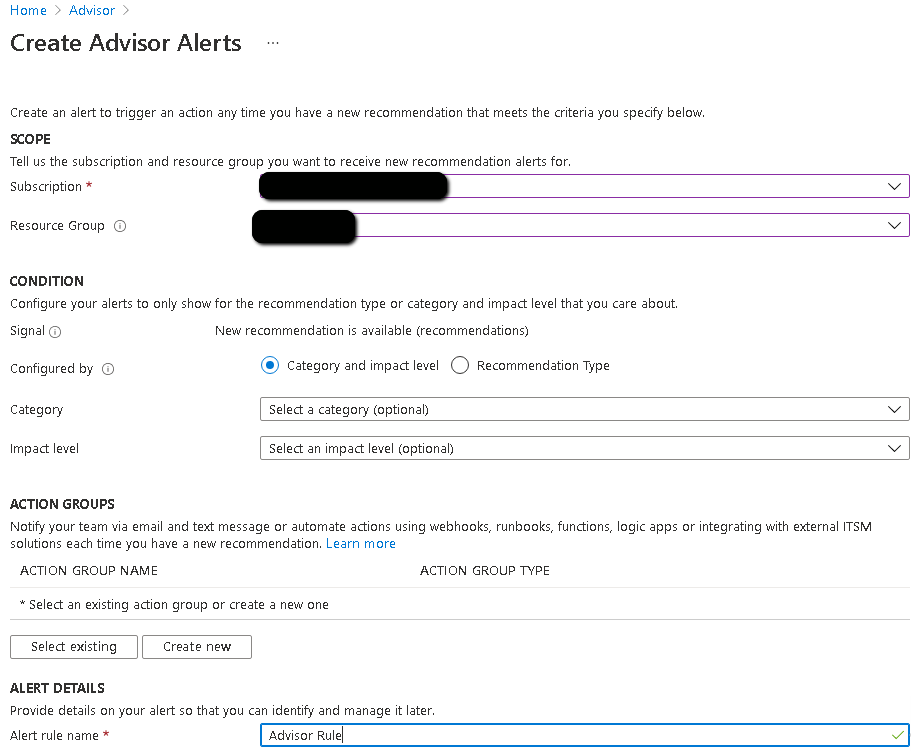
Carry out the procedure below to configure Azure Advisor Alerts:
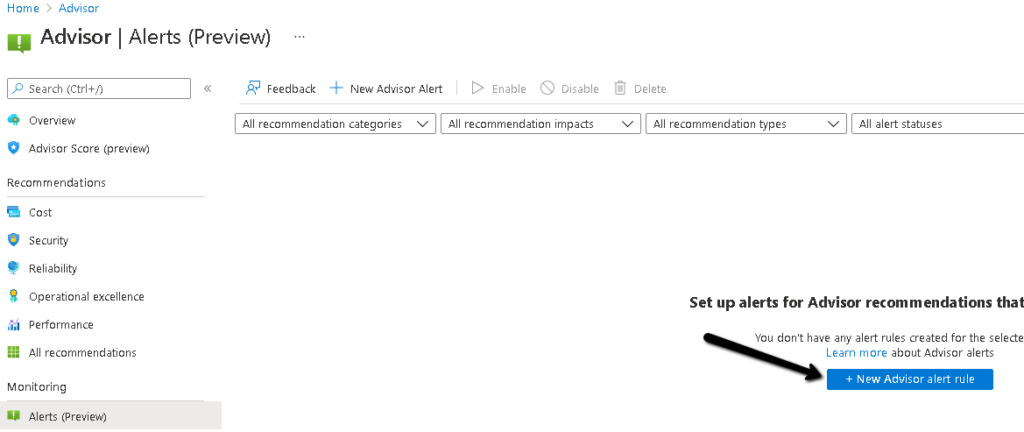
2. Define the scope, condition, action group and alert details and click "Create Alert".
Azure services status page #
Always visit the following Azure status page via browser or RSS reader :
https://status.azure.com/en-us/status
Integration with monitoring systems #
Azure gives you the option to integrate Azure monitor with a handful of IT monitoring systems, including System Center Operations Manager and SERVICE NOW. Review the following articles for more details on how to activate integration with ITSM connector for Service Now.
- https://azure.microsoft.com/en-us/updates/azure-monitor-itsm-connector-for-servicenow-itom-with-secure-export/
- https://azure.microsoft.com/en-us/updates/azure-monitor-itsm-connector-for-servicenow-itom-with-secure-export/
Also remember that you can make use of Azure Arc and the Windows Admin Center to integrate on-premises resource monitoring and alerting with Azure Monitor. More details on Azure Arc and Microsoft Admin Center monitoring are available in the following articles:
- https://techcommunity.microsoft.com/t5/itops-talk-blog/azure-monitor-for-azure-arc-enabled-servers/ba-p/1566654
- https://docs.microsoft.com/en-us/windows-server/manage/windows-admin-center/azure/azure-monitor
Sources #
https://docs.microsoft.com/en-us/azure/defender-for-cloud/configure-email-notifications
https://docs.microsoft.com/en-us/azure/service-health/service-notifications
https://docs.microsoft.com/en-us/azure/azure-monitor/alerts/alerts-overview
https://azure.microsoft.com/en-us/blog/three-ways-to-get-notified-about-azure-service-issues/


